
Written By: Matt Wort, NZIE
2025 is sure to be a year full of advances and twists in the world of social media.
DataReportal is our go-to for all our digital marketing data updates – it allows us to plan out the quarter ahead, look back to identify patterns, and prepare for long-term trends.
Before we get stuck in though it’s important to know that a lot of the stats below reference ad reach – this is used to uncover more reliable data. Sometimes you may have more than one social media account per platform, (remember that one Instagram page you made in 2012 where you were certain you were about to become a fashion influencer? Oh, me neither). Well, ad reach allows us a clearer look past these duplicates! That being said, let’s get stuck into the state of the social media stats for 2025!
Let’s Look at the Highlights!
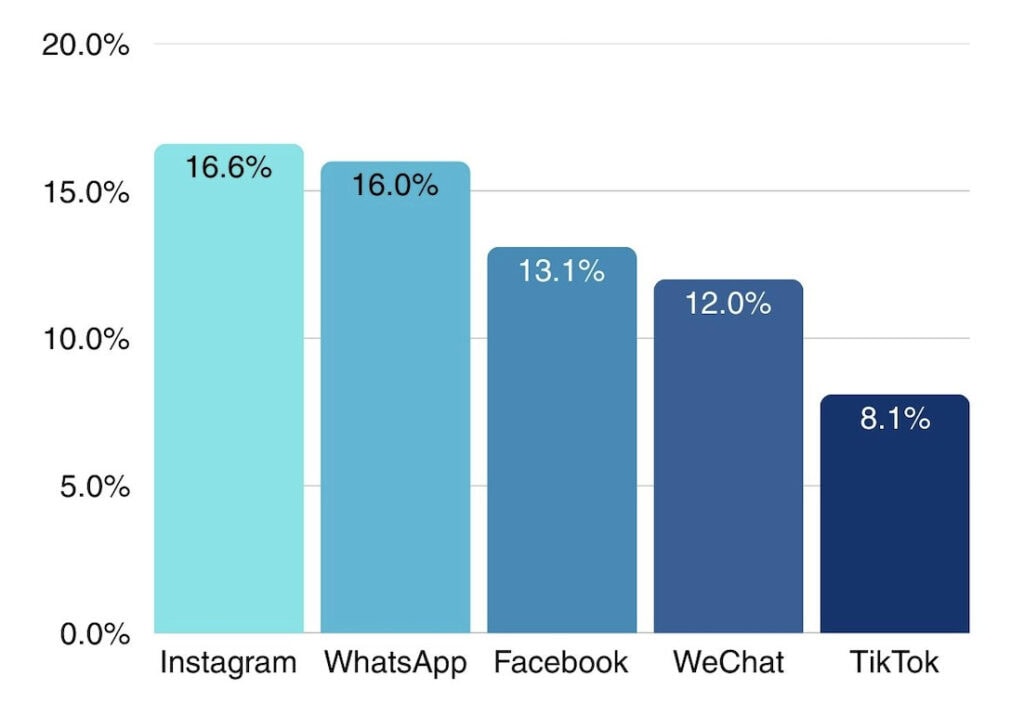
Voted by the users – here are the top 5 favourite social media platforms:
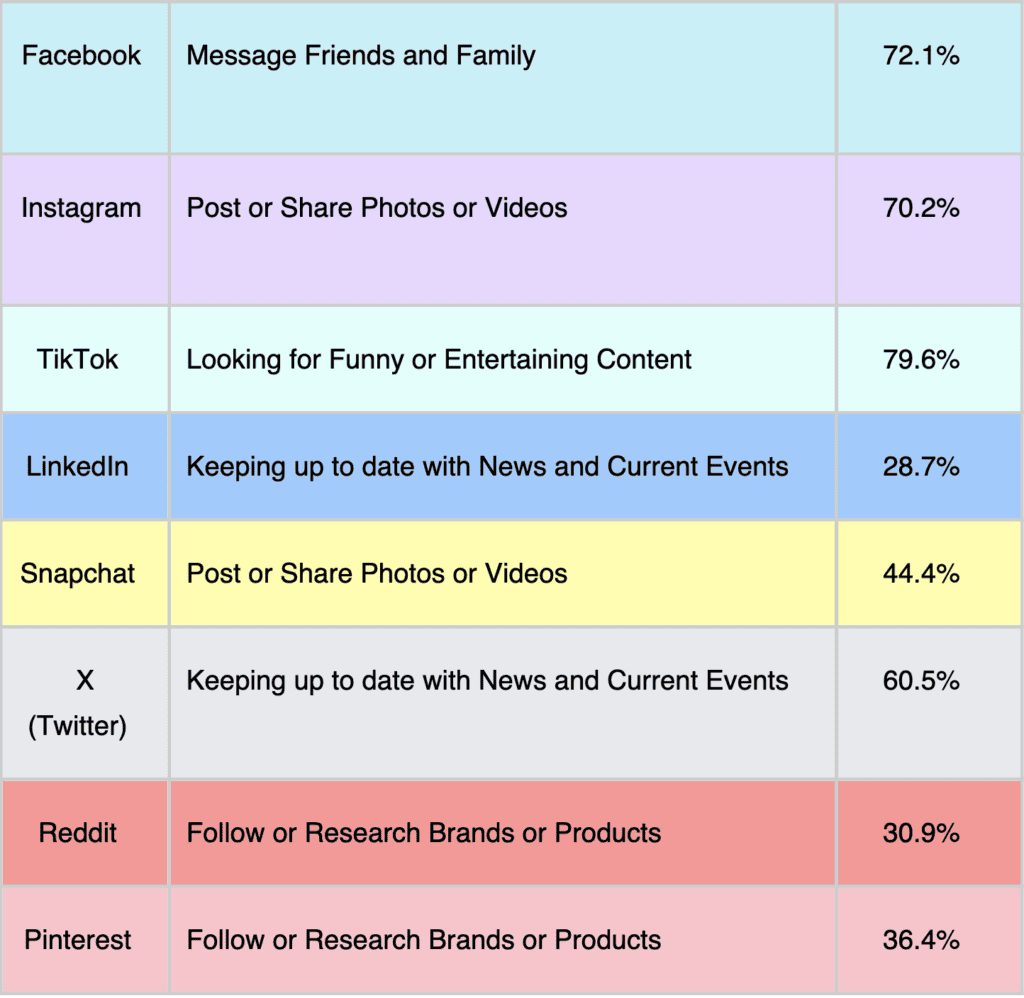
Adults who use social media say they have between 4-5 reasons for using social. But let’s take a look at the reason most of us go to each platform!
Next up we turn to using social media in the workplace. We’re not talking about watching a cheeky reel at morning tea. Around 1 in 3 (38.3%) people now say they use at least one social media platform for work-related activities.
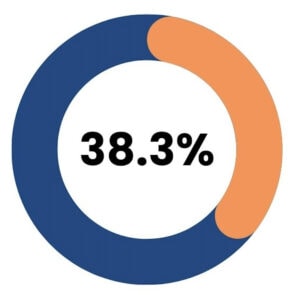
This has seen a slight increase over the past 12 months, and with it trending upwards, we can expect to see this steadily increase over the year as more and more businesses turn to social to share their stories, promote their products, and connect with their audience.
The internet is part of our daily lives – but just how much time does it suck up? Across the world, the average time spent per day on the internet has climbed slightly over the past year to now hit 6 hours and 38 minutes a day!
How often do you open TikTok? Well, the global average is 358 sessions per month! It’s a good thing we’ve moved on from flip phones or those hinges would be struggling.
Comparing NZ to the rest of the world
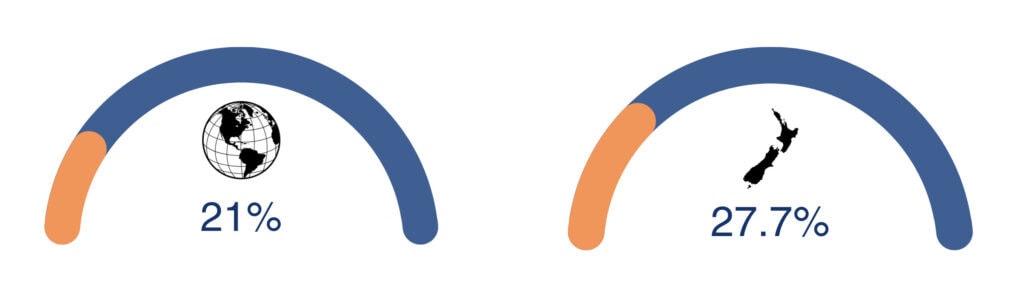
Whether we’re looking to learn a new skill or hang out with a specific creator: our percentage of following influencers and experts on social media is climbing, especially here in New Zealand!
Worldwide, 21% of people say they follow influencers or experts here on social media, while in New Zealand, that shoots up to 27.7%!
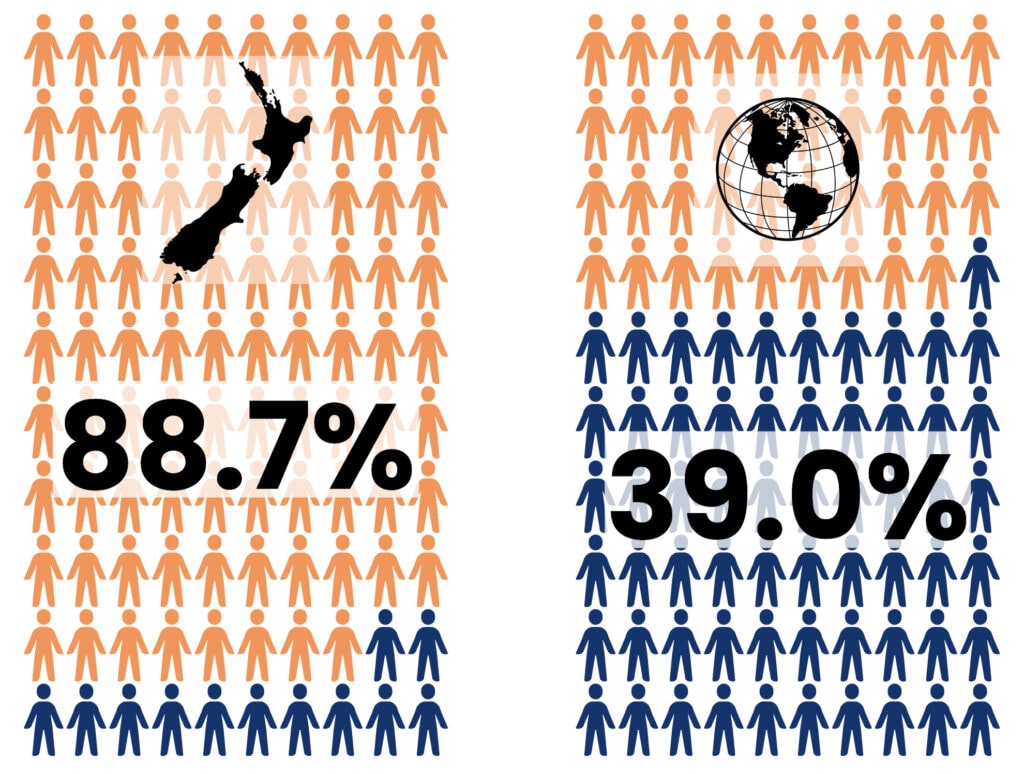
YouTube ads now reach a potential 39% of adults worldwide, but that’s nothing compared to the reach of YouTube ads here at home in New Zealand.
By country, New Zealand is 6th highest in the world for YouTube Ads potential reach, at 88.7% of the adult population. For a small country, we are pulling our weight with these stats!
On TikTok it looks like we’re taking a break from doom-scrolling, at least compared to the rest of the world. The average time spent on TikTok by users globally is 34 hours and 56 a month. Almost a day and a half spent on TikTok every month!
Here in New Zealand, we’re looking a little more balanced, but the average Kiwi user is still spending almost a full day on TikTok a month!
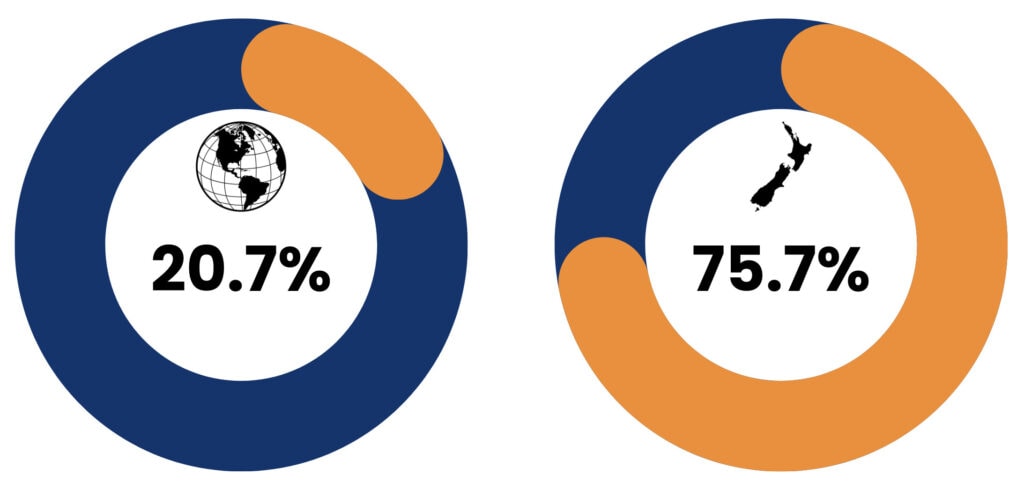
Another big leap New Zealand’s taken over the global average is LinkedIn’s advertising reach rate. Which sits at 20.7% of the global population, but it looks like we’re keen networkers – with LinkedIn’s advertising reach in New Zealand estimated at over 75% of the population.
YouTube
The latest data from YouTube shows that YouTube’s ads now reach at least 2.5 billion users each month. While some of those might be toddlers watching Cocomelon on their parent’s account, that still shows a massive chunk of the world’s population is now reached by ads here on this platform, whether through their app, browser, or YouTube TV.
Now, due to some fussy classification rules, YouTube is often not thought of as a social media platform – but instead, as a video platform like Vimeo. However, if YouTube were considered a social media platform by all researchers involved in the DataReportal findings, it’s clear that YouTube would be the most used platform at the start of 2025, closely followed by WhatsApp, then Facebook.
*This does not include data from China due to the differences in app stores.
Meta had a tumultuous end to the year with declining results across a number of areas within Facebook. Instagram hasn’t done too badly, but it’s seen a drop too.
Our first metric of note here on Facebook is that the average monthly time spent on the app has dropped by almost an hour and a half from August 24 to November 24, with the global average user now spending 17 hours and 17 minutes on the platform per month.
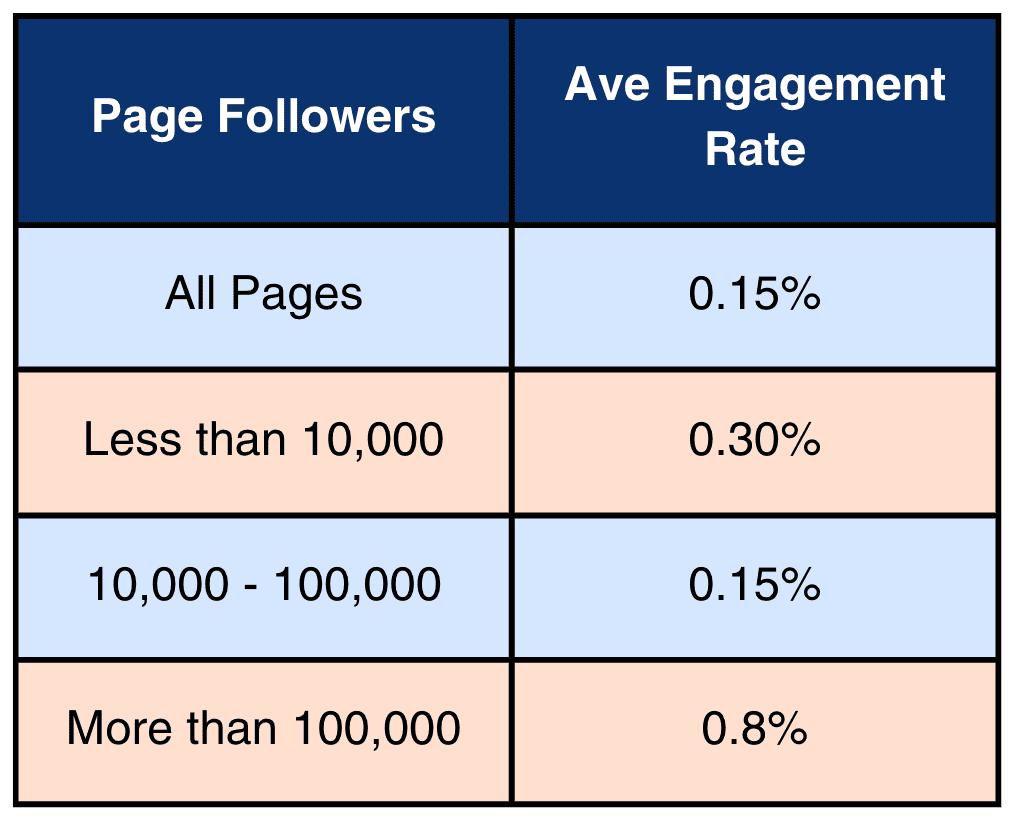
A drop in engagement rate is our next focus. Declining engagements have been seen across plenty of platforms over the recent months, but taking a look more specifically at the current rates here on Facebook, they paint a pretty bleak picture.
Average Post Engagement (vs. Page Followers)
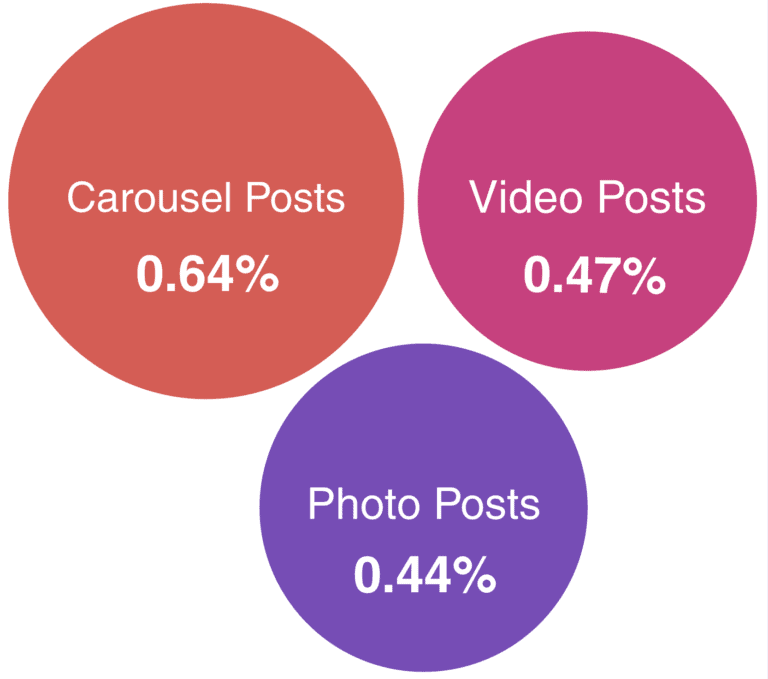
Our biggest takeaway for Instagram isn’t a positive one – take a look at the engagement rates for Business pages across the platform below. The average rate across all post types is 0.49%. This has dropped more than half over the last year. Carousels, as usual, remain our top performers though!
TikTok
Before we get stuck into looking at a stat highlight from TikTok, we should have a chat about their user numbers.
Firstly, the number of accounts reached between October 24, and January 25 dropped by almost 100 million. However, at least four data sources show no signs of a decline in actual TikTok use. Meaning this could have been caused by the removal of duplicate or bot accounts. What does this mean for you? Well, it’s a positive sign moving forward as there’s been no real change in authentic human user behaviours, but it also means that your ad budgets last year may have been wasted by reaching bot accounts, we’ll never know for sure.
Our big takeaway from TikTok is looking at how many sessions the average user has on the platform per day, and how long each session lasts. Famous for fast-paced short-form video, our sessions on the platform are the same – with an average of 12 sessions per day, users spend just under six minutes on average scrolling for each session.
With just six minutes to break into the audience’s “For You Page”, you’ll need to be bold, entertaining, and perhaps most importantly: interesting.
Let’s talk about the ban. It was a rough start to 2025 for TikTok with a shutdown of services in the US before it was back online. It may not have lasted long, but it was the message the ban sent: that platforms could, and would, be switched off. TikTok has bought some time, but its future is still uncertain, and with 8.5% of TikTok’s global ad audience located in the US, a lot of careers and creator’s livelihoods ride on its future.
Reddit spent the year improving its ad structure, including new formats and enhancing the user experience. As a result, they have seen a huge jump in ad reach towards the end of 2024 – more than doubling. This could be down to the better reporting but greater use of the ads by marketers is surely contributing to the rise. With a rise in ad reach this high – Reddit now has the potential to reach 1 in 14 people on Earth!
A bit of controversy on this one! LinkedIn’s own ad tools report that its ads reach 1.2 billion users a month, however, a number of third-party data suggest that LinkedIn reaches 350 million active users per month. LinkedIn does have an audience network of other sites where it places its ads though, so reach is still possibly higher than 350 million.
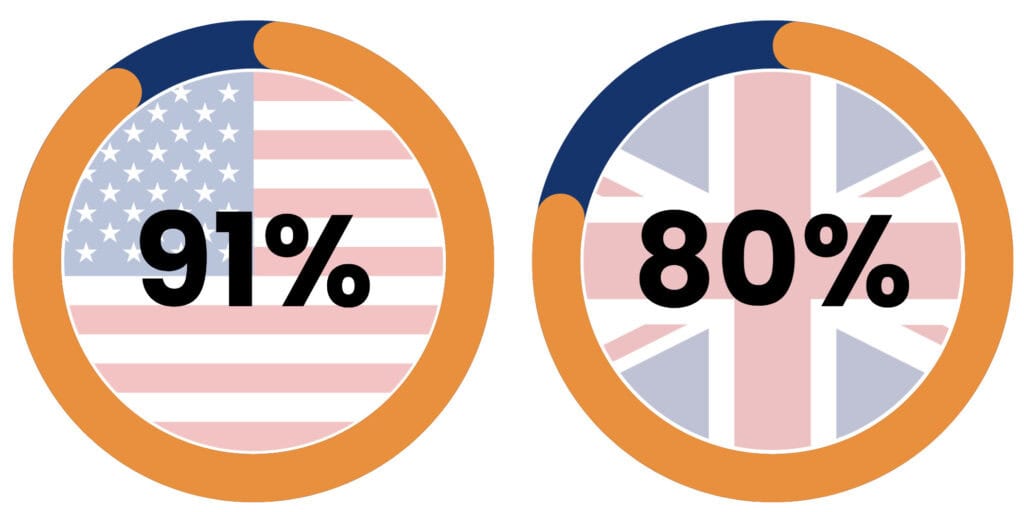
One drawback of the growth in LinkedIn users is that it is seeing signs of saturation in two of its largest markets. The US and the UK reach figures on LinkedIn are so high there won’t be anyone left to bring in.
Pinterest is our stable friend in these uncertain times – always reliable, always trusted! As you’d expect, Pinterest continues its slow and steady growth as a social media platform. Entertaining the creativity of everyone from interior designers, chefs, and wedding planners, to those just looking for crafty ideas on upcycling used tractor tyres (me).
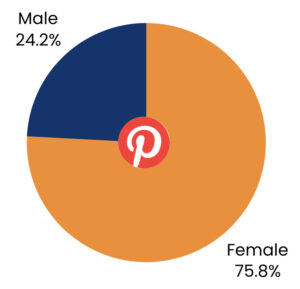
Pinterest is up 32 million users on this time last year, like we said, dependable! It is still one of the only platforms to have a higher Female reach than Male! Their latest gender split is outlined below.
Wrapping Up
While we can look at the trends social media has taken over the past year or two, it’s going to be impossible to predict what comes next. Some facts remain solid, social use increases across our personal and work lives, we’re not getting tired of short-form video,
However, brands have to work harder than ever for engagement, ads outweigh user content, and while our session totals increase, those session times are sometimes very short.
Not to mention the looming threat of bans and boycotts. It will be an uncertain year for social, but uncertainty can be an exciting time for a brand to become an early adopter, trendsetter, and all-around platform icon (looking at you Duo…).
Thanks again to DataReportal for always pulling through with the latest numbers, and if you want to check out the full report you can here!